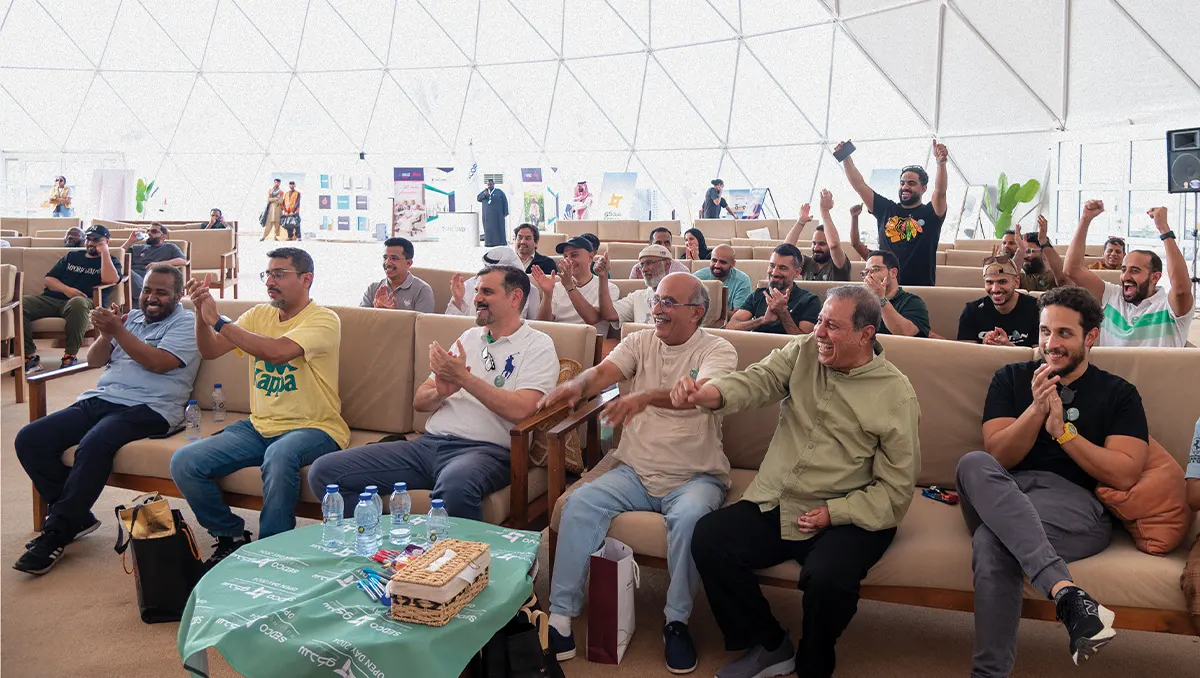







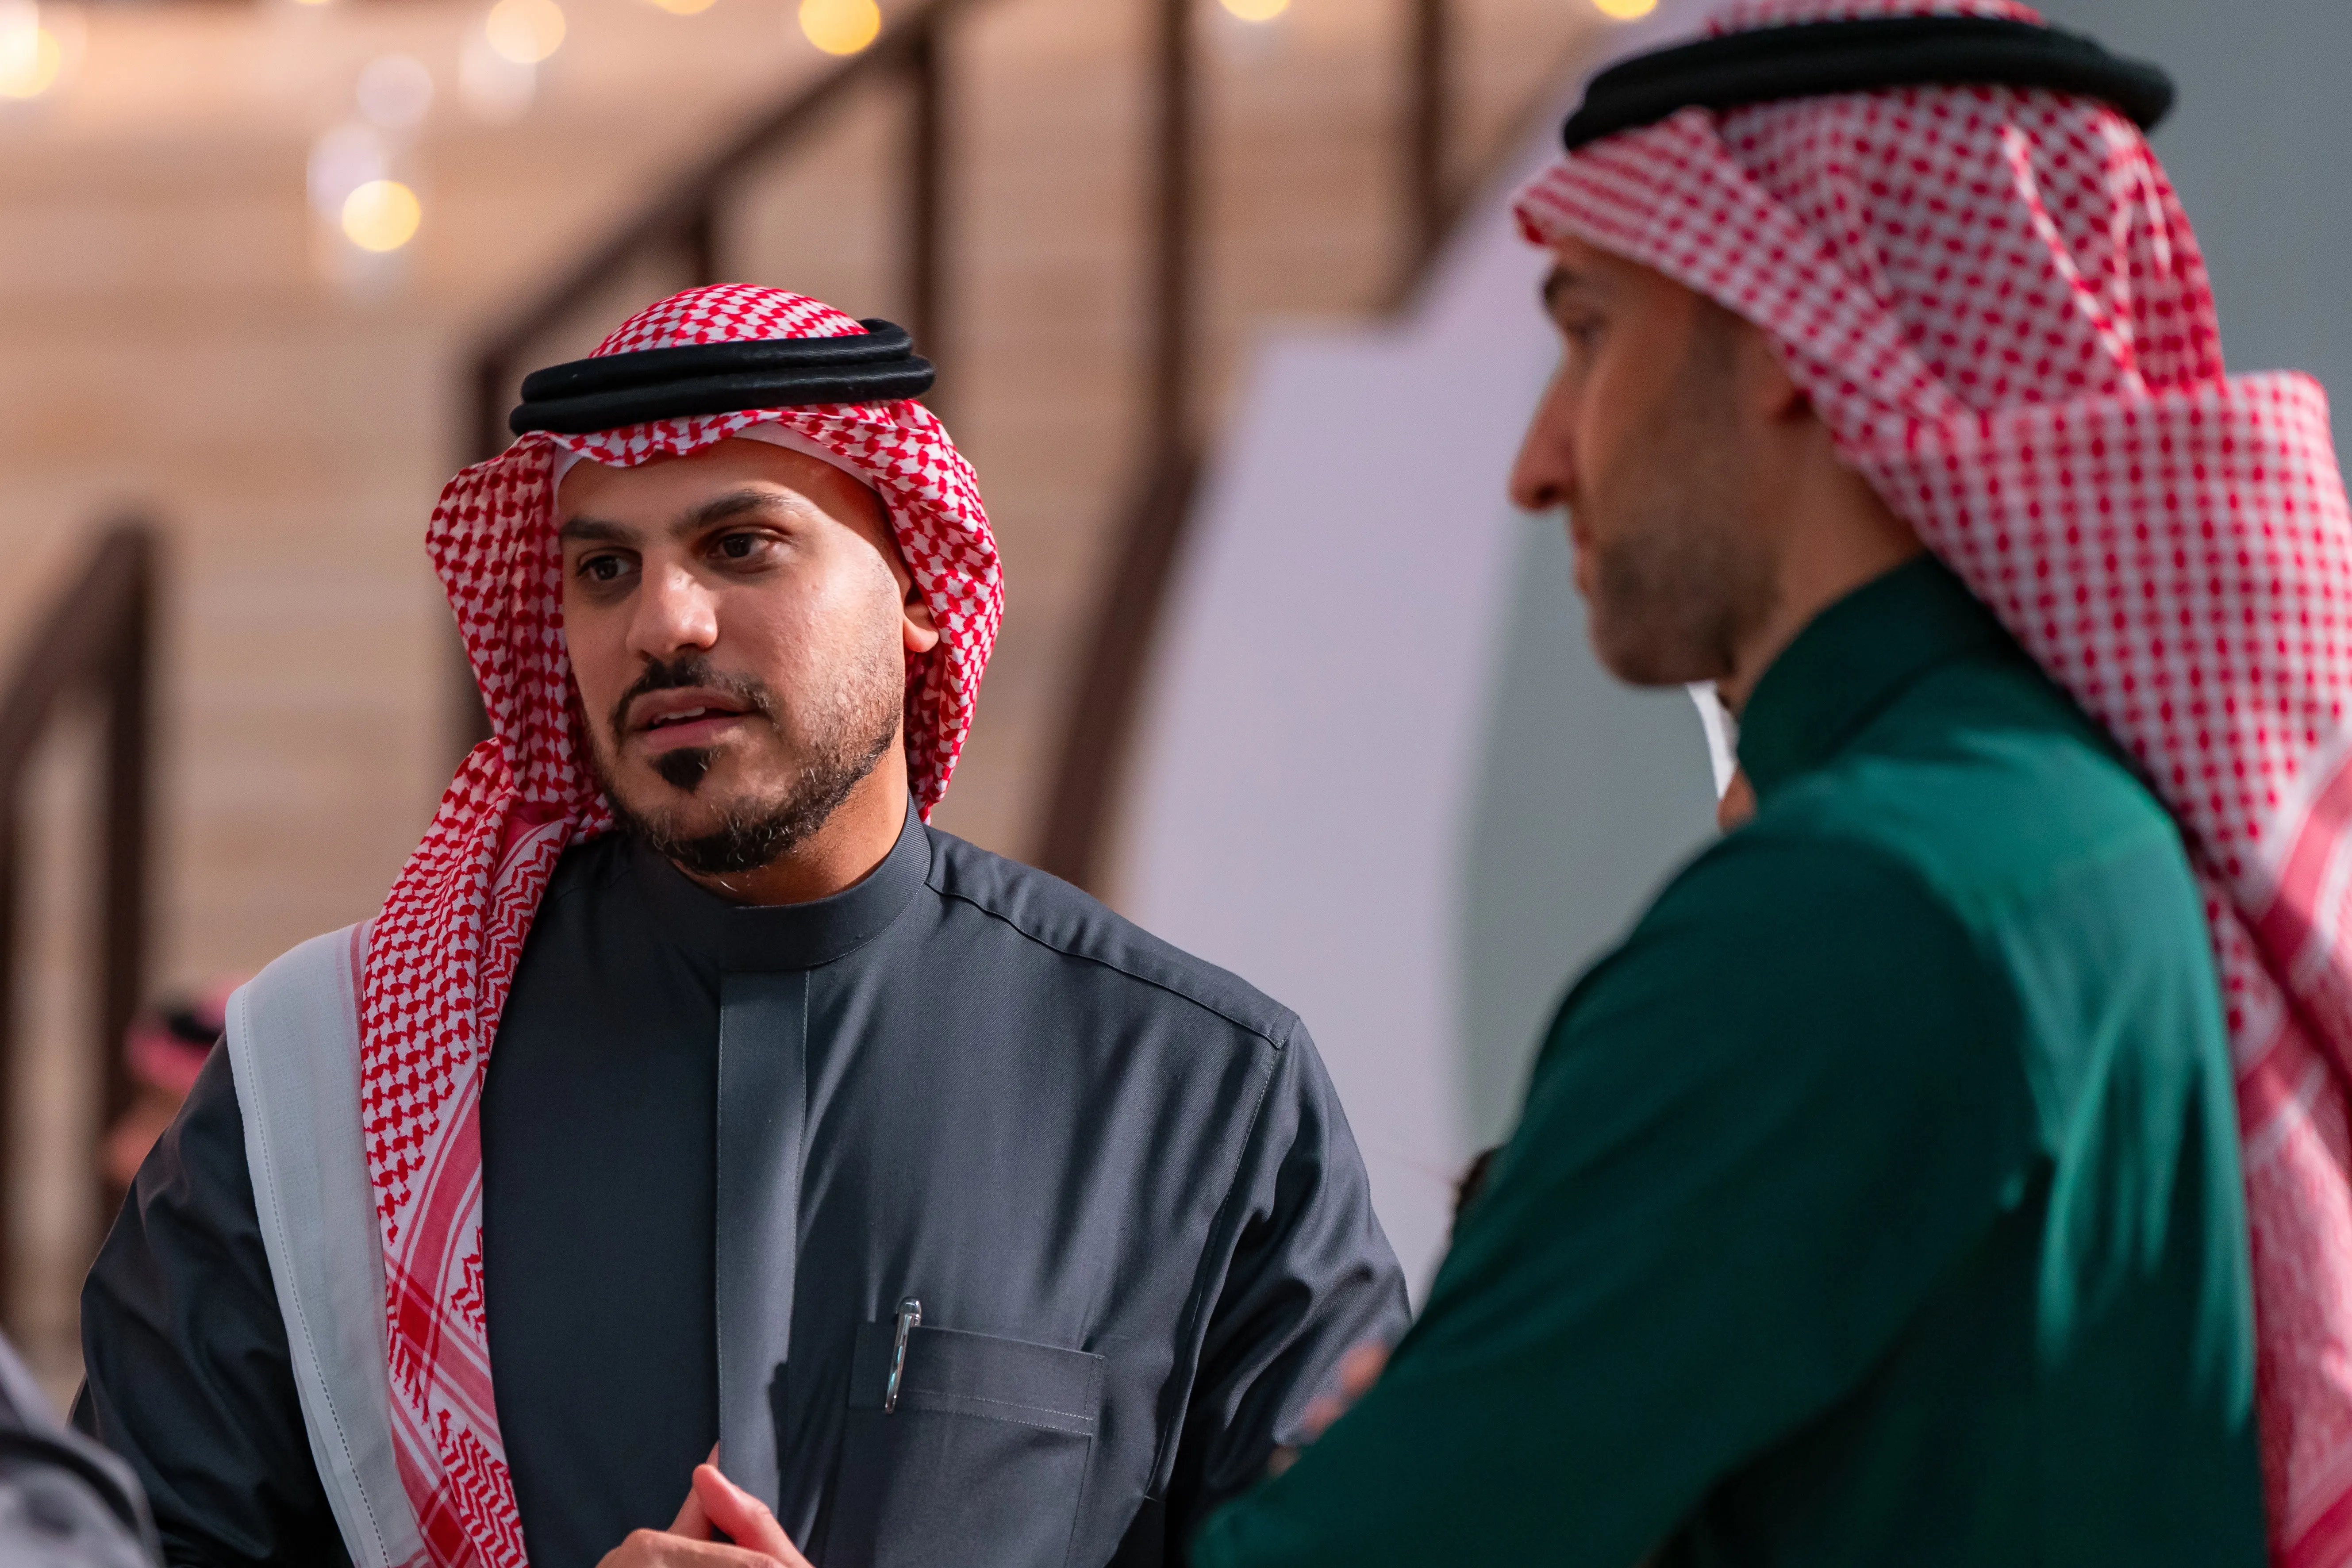
We recognize that our success is built on the strength and well-being of our people. By prioritizing the well-being of our employees and cultivating a collaborative ecosystem, we empower our talent to reach their full potential. Integrating our core values into the fabric of our corporate culture ensures that strategic growth is pursued with an unyielding commitment to the highest ethical and professional standards. This synergy keeps our workforce aligned with SEDCO’s strategic vision and the Kingdom of Saudi Arabia’s national economic objectives.
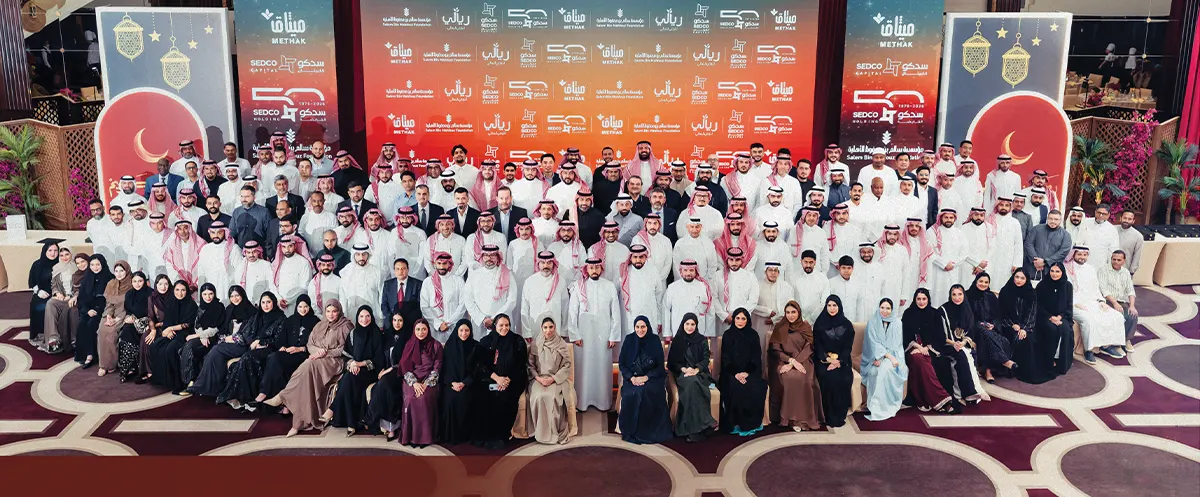
Our Human Resources (HR) strategy is anchored in the dual pillars of digital transformation and employee well-being. Over recent years, SEDCO has successfully institutionalized a digitally-led model, automating the majority of administrative functions to enhance efficiency and service quality. This operational agility is balanced by a deep commitment to the social aspect of our Environmental, Social, and Governance (ESG) mandate. The focus on Saudization remains a key performance indicator, reflecting our role in supporting the national workforce through responsible recruitment and inclusive employment practices.
2025 Strategic Actions and Milestones
During 2025, the HR function spearheaded several initiatives to optimize the organizational structure, enhance leadership readiness, and deepen employee engagement:
Human Capital Snapshot
Workforce Profile
| 2025 | 2024 | 2023 | |
| Total number of employees (full time) | 116 | 119 | 126 |
| Total male employees | 95 | 99 | 106 |
| Total female employees | 21 | 20 | 20 |
| Percentage of female employees (٪) | 18 | 16.8 | 16 |
| Saudization rate (٪) | 73 | 72 | 65 |
(Global Reporting Initiative)
|
GRI 202-2 Percentage of senior management from the local community (٪) |
47 | 50 | 47 |
|
GRI 401-1 Number of new recruitments |
5 | 20 | 10 |
|
GRI 401-1 Employee turnover (numbers) |
8 | 6 | 4 |
| Turnover (attrition) ratio (٪) |
6 | 5 | 3 |
Diversity
Diversity of governing bodies - Senior Management
GRI 405-1| Age group | Female | Male |
| Under 30 years | – | – |
| 30–50 years | – | 12 |
| Over 50 years | – | 3 |
Age diversity of employees
GRI 405-1| Age group | Female | Male |
| Under 30 years | 10 | 4 |
|
30–50 years |
11 | 68 |
|
Over 50 years |
– | 23 |
Training and Development
| 2025 | 2024 | |
| Average training hours (or man-days) per employee | 45 | 45 |
| Total training hours for employees | 5,000+ | 5,000+ |
| Number of training courses/modules conducted or completed | 70 | 164 |
|
GRI 404-3 Percentage of employees receiving regular performance and career development reviews (٪) |
100 | 100 |
Employee Engagement
| 2025 | 2024 | |
| Employee engagement rate (٪) | 83 | 83 |
| Employee satisfaction rate (٪) | 87 | 88 |
|
GRI 406-1 Number of incidents of discrimination and corrective actions taken |
0 | 0 |